Hear the Truth
Hear the Truth
$44,210,000 Verdict
Construction Accident |
Wrongful Death
$14,000,000 Verdict
Construction Accident
$4,800,000 Settlement
Product liability
$4,500,000 Settlement
Fall from ladder
New York Attorneys
Practice Areas


Let us review your potential case at no cost or obligation
More Practice Areas
Why Choose Us

Experience
Legal Skills

Direct Contact
Employment Law Attorneys
- Wage and Hour Violations
- Overtime Violations against Misclassified Employees
- Disability / Age Discrimination / Pregnancy Discrimination
- Wrongful Termination
- Prevailing Wage Issues in Construction
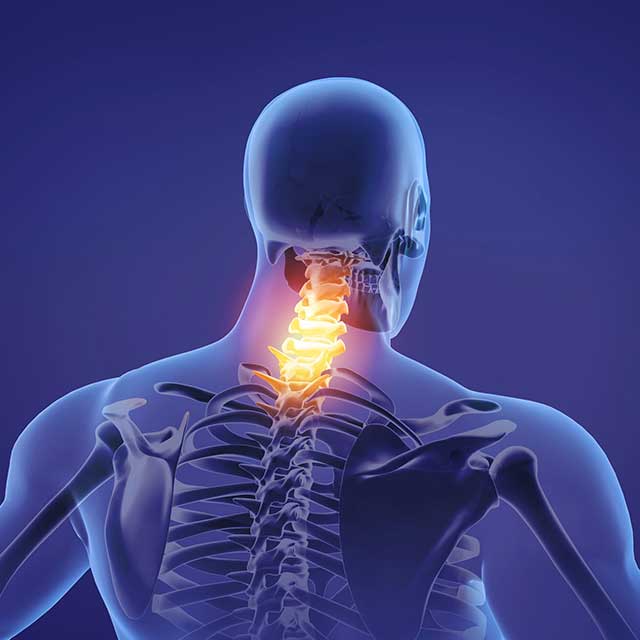
Personal Injury Law
NY Lawyers Fight to Maximize Recovery
Gearing Cases for Trial Presentation
Legal News and Information
Our Blog

¿HA SIDO VIOLADA O APROVECHADA SEXUALMENTE?
¿ESTÁ CONSIDERANDO DEMANDAR PERO NO QUIERE QUE TODO EL MUNDO LO SEPA? Posiblemente puede demandar bajo el nombre "Jane Doe" (o "John Doe"). Eso es sumamente importante porque casi todas las demandas están disponible al público el en el Internet. El derecho...

Sexually Assaulted and Considering Suing?
Sexually Assaulted and Considering Suing? by Bill Cafaro | Jan 16, 2025 | Author: Bill Cafaro: Amit Kumar, Sexually Assaulted | 0 comments The Whole World Doesn't Have To Know? You might be able to sue under the name "Jane Doe" (or "John Doe), This is very important...

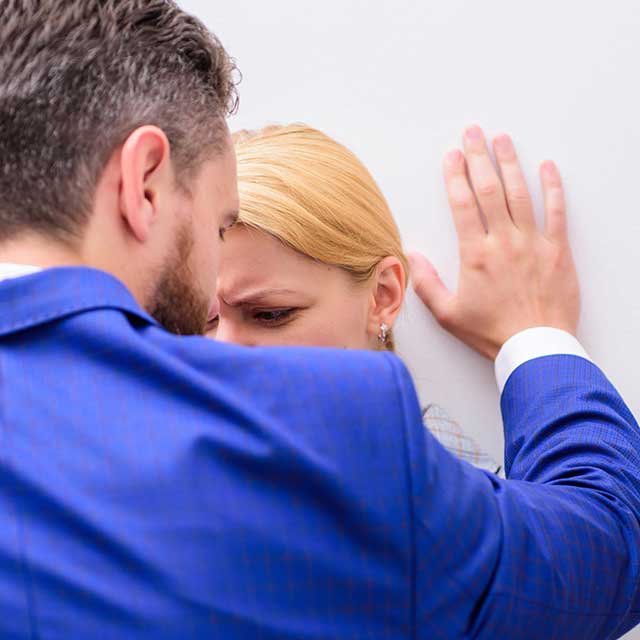
Why Do Women Say I “Froze Up” During Sexual Assault?
They’re Not Making This Up – Read About Why When describing date rape or other types of sexual assault, women commonly say “I just froze up” instead of fighting back or crying out. This is a scientifically recognized reaction behavioral experts call “Tonic...

¿Están Pagándome Menos Que el Sueldo Mínimo Legal?
¡Puede ser que tenga el derecho legal para demandarle POR EL DOBLE de la cantidad de lo que él no le ha pagado! Si usted trabaja en NYC, Long Island o Westchester, generalmente el sueldo mínimo subió a $16.50 la hora y $24.75 la hora por horas extras el 1ro enero...

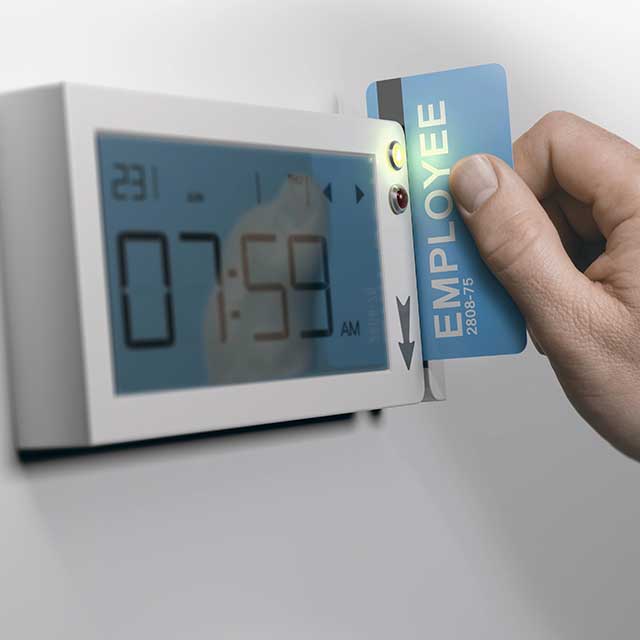
Is Your Boss Paying You Less Than the Legal Minimum Wage?
Very Recent Minimum Wage Changes in New York Include Tipped Employees If you have a minimum wage job, and your boss is not paying you the legal required minimum wage, you may have the right to sue for DOUBLE THE AMOUNT of What He Didn’t Pay You! If you work in NYC,...
Find out if you have a case.
Let's talk
Our response to an e-mail inquiry cannot create an attorney-client relationship or authorize us to do any work on your case.